Class Introduction

There is 2.5 quintillion bytes of data created every single day, and it's growing rapidly! By 2020, it's estimated that 1.7MB of data will be created every second for every person on earth.

Machine Learning patents grew at a 34% Compound Annual Growth Rate (CAGR) between 2013 and 2017, the third-fastest growing category of all patents granted. Additionally, International Data Corporation (IDC) forecasts that spending on AI and ML will grow from $12B in 2017 to $57.6B by 2021.

The opportunity is massive data growth, advanced computing power, and then cheap storage. The combination of these three propels us into more careers in data driven projects using ML and AI.

Mastering Applied Data Science is a project-driven course that will teach students the practical aspects of Data Science, such as collecting data by web scrapping, validation of information in data by data analysis, comparing models created by ML algorithms by interpreted metrics, and more.

Additionally, we dive into the more enhanced aspects of data science by introducing topics, such as recommender systems, natural language processing (NPL), and Computer Vision, which are all in everyday applications of AI.

Our classes provide background and insights while solidifying the ideals through hands-on in-class projects and in depth real life business projects. Students are expected to present their findings and documentations on their journey throughout their project and explain further on what would be their next step to solve the business problem.

Class Duration: 12 weeks

Days: Monday/Wednesday/Sunday or Saturday/Sunday (weekday office and mentoring hours are available)

Time: Monday/Wednesday - 5pm-9pm; Saturday/Sunday - 10am – 6pm

Locations: Los Angeles - CA, Irvine - CA, San Diego - CA, Walnut Creek - CA, Lacey - WA

Price: $9,995 (Financial options available)

Prerequisites and Requirements: Yes, Pre-Work is required, included in the price.

Do you offer a Certificate? Yes, at completion you will receive a certificate from theDevMasters showcasing the 400 hours you've completed in our nationally recognized course!

Why you should take this class?

  • In-person Training
  • Applied Labs; an Innovative Way to Learn
  • 100% Hands-On Learning
  • Project Based Learning
  • Mastermind Project Groups and Interview Prep Groups
  • Repeat Project or Session Anytime

Related Courses: Python 101, Stats 101, SQL 101, Web 101, delivered as Pre-Work to this course.

Teachers & Credentials: Zia, Sidy, Jay, Kate, Mohammad, Arshad.

Average Salary Post Graduation: Refer Glassdoor: $95k in Los Angeles area.

Who is this class best suited for?:

This class is open for all backgrounds; there is a pre-requisite which is completed through Pre-Work to assure students are setup for success..

  • Someone looking to change their career,
  • Someone looking to improve their knowledge and gain skills to become a leader and leverage themselves in the chosen field,
  • College students and recent graduates looking for hands-on experience and to fill the gap between school and real world applications.

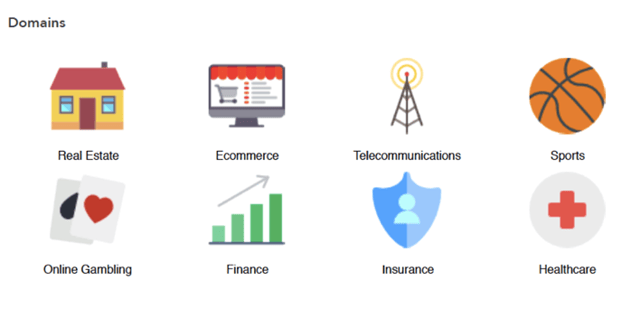
Our graduates backgrounds include: marketing, engineering, healthcare services, insurance, education, real estate, manufacturing, e-commerce, sports, on demand services, etc.

Class Size: 5:1, student-to-teacher ratio.

Data Science Boot Camp


Any Questions Call : 888-713-9711

Mastering Data Science Applied Labs 

PreWork

Session I : Python 101

Whether you are familiar with programming or not, our Python PreWork sessions introduce the fundamentals of Python, such as variables, string fundamentals, if-else statements, try & except statements, for loops, while loops, break & continue statements, & lambda functions, as well as certain data types relevant to data science, like lists, tuples, dictionaries, & sets for beginning exposure. The activities done in these sessions will be guides to student’s questions moving forward in the classes.

Session II : Statistics 101

The hands-on portion of statistics in PreWork is to establish the surface level understanding of concepts such as mathematical variables, like numerical vs categorical, nominal vs ordinal, interval vs discrete; measurements of statistics, like when to use mean, when to consider median, & when to revised to mode; relationship between variables, like correlation & independence; ending with hypothesis testing & p-value, but only to the degree of applying the mindset towards data science. These concepts will be reviewed in the program to ensure that student’s clarifications are addressed.

Session III : SQL 101

While some of the tools used in Python will take the place of SQL functions & methods, it is still beneficial to understand the origins of these tools as well as be able to replicate them when applied in future work’s expectations. A solid portion of demand in data science jobs ask for big-query experience with SQL, like Microsoft SQL & PostgreSQL vs NoSQL, like MongoDB & DynamoDB, which we will glimpse at scenarios to further solidify the students’ candidacy.

Session IV : Web 101

An introduction to HTML & CSS is key to future project building & publications of the blog posts of student progress throughout the program. A proportion of relevant data is out there in the web for us to utilize & using the most open source methods, like HTML & CSS to be able to grab that information within our Python environments will be introduced in Day 3 & furthermore, once students are in Project Based Learning, GitHub portfolios are best displayed in themes that students choose & customize with HTML & CSS.

Applied Labs

Session I : Introduction to Data Science with Python

In our first class, we will go over some intermediate functions in Python as review & move onto introducing what is the expected mindset of a data scientist versus the traditional viewpoint & how to take full advantage of the program by using the Applied Labs environment. We will encourage students to introduce themselves to each other & gather each other’s strengths, along with the instructor’s experience to not only grasp the skills & tools a data scientist is expected to know, but know exactly when to use which tools & why through peer & real-life learning. There will also be an introduction to the CRISP-DM data science methodology & chosen framework with the distinctions between the two mindsets of machine learning: supervised learning & unsupervised learning. The session has two miniature projects, Temperature & Christmas, to wrap up Python essentials

Project 1: How Much Longer Until Christmas?

Session II : Exploratory Data Analysis

We start by asking the questions that data science can help answer for students to identify the difference between a data analytical question vs a data science question. We further breakdown what are the key checklist items in form of questions that CRISP-DM individual stages require before moving further in the cycle. We again showcase the
peculiarities between supervised learning & unsupervised learning & explain why sometimes supervised learning is the method that most of us will encounter, but unsupervised learning will elaborate more patterns in data than we can ever imagine. We introduce the self-checking mindset of what is considered good data for data science projects: what is good data & how can we detect bad data from good data, & we let the students ponder how we can tackle dirty data. We then give the attributes to help students identify big data from small data through the four V’s. A small review on what are the differences between mathematical variables, numerical vs categorical along with a short case of where statistics are required the most in data science: the data analysis phase. The hands-on portion of the class familiarizes students with NumPy and Pandas and showcasing how to clean, manipulate, and analyze data by applying those concepts. Students will be given the data set for Titanic, a Kaggle competition known for introductory data science methods & cleaning, practicing data analysis skills on the Titanic dataset with Pandas to get students in the data science mindset of resultoriented, instead of process-oriented.

Project 2: Exploration of Titanic

Session III : Data Visualization & Information Analysis

We start off by asking what is the purpose of visualization in data science, broadening on student’s experiences with charting & decision making with charts. A review of NumPy functions for generating different types of data is done before a brief introduction to Matplotlib’s figure attributes & properties. Instructors will continue with explaining what are the most common analysis-based visuals, such as histograms & scatterplots. An intermediate approach to Titanic is used for exercises with graphing in Matplotlib & analyzing whether the graph is deemed useful or not. We continue with creating a Python-based method for web-scraping & introduction to JSON. There are further functions & helpful tips to consider analyzing data with Pandas, such as common Excel functions implemented to insights. The day ends with a project on what happened during the 2012 election & whether the data of polls can give us clues into who was more likely to win. A GitHub repository is expected to be created by the end of this session & students will learn how to create their own blog & begin to publish content.

Project 3: Election Day Results

Session IV : Machine Learning

We will review by explaining the difference between supervised learning and unsupervised learning, asking students why certain scenarios will not be effective for supervised learning. Furthermore, an explanation on the two result-oriented methods of supervised learning, regression & classification are distinctly introduced. The day is dedicated to determining a regression problem, immediate analysis to modeling using regression methods, assessing the models, then optimizing for the best results by different metrics. Afterwards, students will work on building one of the regression models introduced, such as linear, polynomial, ridge, lasso, gradient, robust, & an introduction to logistic regression for classification. The day end with a Kaggle based project using regression.

Project 4: Optimizing House Price Prediction

Session V : Advanced Machine Learning

Revisiting the results that students ended their House Pricing project with, we will give more hints & clues to how to approach the project further. We will then dive into the second supervised learning need: classification algorithms, such as Naïve Bayes, Decision Trees, Random Forest, and other methods based on regression. Students are expected to be able to identify when a certain algorithm will be used based on the data & which methods to optimize classification algorithms further to what is appropriate for insights & decisions. Students will also learn metrics such as R-squared, MSE & RMSE, & scoring using precision, recall, sensitivity, specificity, and accuracy score, AUC, and ROC, along with gains & lift charts. The session ends with a Spam Classifier project, which eludes to the processes of Natural Language Processing.

Project 5: Classification of Spam Emails

Session VI : Hack Day

Students will be separated into two groups & able to truly practice their skills, emphasizing on visualization & modeling with machine learning, with a live Kaggle competition. During this time working with others, students will also be encouraged to identify the gaps in their skills, especially in analysis & modeling, in the project & review as much as possible moving forward to other projects in the continual sessions.

Project 6: Baseline Kaggle Competition

Session VII : Recommender Systems

Students will review machine learning algorithms and be introduced to types of recommender systems, like collaborative filtering with k-nearest, using either items or users, like Amazon’s. Then students will start by building their own recommender system with the MovieLens dataset, elaborating on what to consider as the best method for selection & integrating with what viewers of recommender results will use best; understanding dimension reduction with PCA, principle component analysis; explore SVM, support vector machines; and learn A/B Testing with T-Tests and P-Value methods.

Project 7: MovieLens Through Recommendations

Session VIII : Natural Language Processing & Sentiment Analysis

Students will explore the Natural Language Toolkit to process and extract text data: learning about tokenization of words & sentences, part-of-speech tagging & stemming with lemmatization for the best analysis of textual data. Students will then start a Natural Language Processing project with Yelp data before we move onto Sentimental Analysis to predict positive versus negative Yelp reviews.

Project 8: Yelp Reviews & the Truth from Customers

Session IX : Big Data with Spark & Splunk

Students will be introduced to Big Data and data engineering with the Hadoop ecosystem, the MapReduce paradigm, Apache Spark, and the up-and-coming Splunk, where real-time data is represented in a dashboard format for easier assessment. An existing project, such as MovieLens, will be transferred to AWS to expose students to the difference.

Project 9: MovieLens Through Big Data & Splunk

Session X : Deep Learning and Time Series

Instructors will make sure that student’s understanding of unsupervised learning & supervised learning is reclarified & where does deep learning come in. We will be introducing deep learning through TensorFlow and training neural network and visualizing what a neural network has learned using TensorFlow Playground. Students will also learn time series, what makes them special, loading and handling time series in Pandas. Students will understand how seasonality affects trends. Projects for this session include handwriting recognition & digital face recognition.

Project 10: Hand-writing Recognition

Session XI : Computer Vision with OpenCV and Hack Project

After initial installation, we will expand on the notion why letting computers understand images is harder said then done when compared to the way humans & eyes process images. Then, students will be introduced to computer vision fundamentals using OpenCV to detect faces, people, cars, and other objects, even when images are manipulated in rotations or scaling situations. Projects will use sensors such as student’s webcam to create a real-time facial recognition program & object recognition program.

Project 11: Facial Recognition

Session XII : Hack Day

In the last session, we will host a private Kaggle competition amongst the students. Students will be grouped into teams and will showcase their group project at the end of class. This will also be a career day, where we will assess students on their presentation skills, as well as their business skills in terms of the project.

Project 12: Private Kaggle Competition

Project Based Learning

PROJECT 1: Skill Assessment

Students will apply the Cross Industry Standard Process for Data Mining (CRISP-DM) standard in a provided data set to understand the process behind starting a new project. We will recommend individual students to tackle different aspects of CRISP-DM that need more practice in, such as visualization, data understanding, or modeling.

PROJECT 2: End-to-End Development

Students will undertake a new project from start to finish. This project will allow students to demonstrate their skills in data acquisition, data cleaning, data enrichment, modeling, evaluation, and deployment.

PROJECT 3: Your Own Data

As a third project, theDevMasters encourages students to bring their own data in their chosen domain for additional mentoring. Since these projects might entail more opinions & guidance, theDevMasters will proceed to transfer the third project over to the Mastermind group.

Capture.png